Charts
Tailbreeze uses Chart.js for all of it’s charting content. Chart.js is a free and open source HTML5 based JavaScript charting library. It is easy to use, responsive, flexible and feature rich. It supports different chart types like line, bar, pie, radar, polar area, bubble and scatter charts.
Official documentation: https://www.chartjs.org/
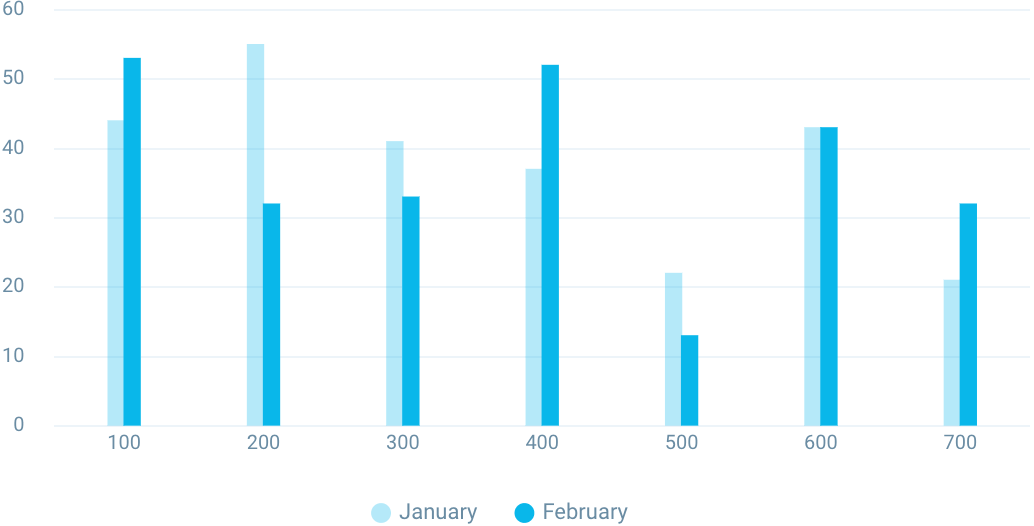
Bar Chart
A bar chart provides a way of showing data values represented as vertical bars. It is sometimes used to show trend data, and the comparison of multiple data sets side by side.
<div class="h-72">
    <canvas id="chart-bar"></canvas>
</div>
import Chart from "chart.js/auto";
import { CHART_TICKS, chartTooltipStyle, CHART_LEGEND_LABEL, CHART_GRID } from "../../vendors/chart";
import { COLORS } from "../../constants";

export const bar = () => {
	const WRAPPER = document.getElementById("chart-bar");

	// Chart data
	const DATA = {
		labels: ["100", "200", "300", "400", "500", "600", "700"],
		datasets: [
			{
				label: "January",
				data: [44, 55, 41, 37, 22, 43, 21],
				barThickness: 8,
				backgroundColor: "rgba(9, 182, 234, 0.30)",
				hoverBackgroundColor: "rgba(9, 182, 234, 0.30)",
			},
			{
				label: "February",
				data: [53, 32, 33, 52, 13, 43, 32],
				barThickness: 8,
				backgroundColor: "#09b7ea",
				hoverBackgroundColor: "#09b7ea",
			},
		],
	};

	// Chart config
	const CONFIG = {
		type: "bar",
		data: DATA,
		options: {
			maintainAspectRatio: false,
			layout: {
				padding: {
					left: -8,
					right: 15,
				},
			},
			elements: {
				bar: {
					borderWidth: 0,
				},
			},
			responsive: true,
			plugins: {
				legend: {
					position: "bottom",
					labels: {
						color: COLORS.MUTED,
						usePointStyle: true,
						...CHART_LEGEND_LABEL,
					},
				},
				title: {
					display: false,
				},
				tooltip: {
					...chartTooltipStyle,
				},
			},
			scales: {
				x: {
					border: {
						display: false,
					},
					grid: {
						display: false,
						drawBorder: false,
						drawOnChartArea: false,
						drawTicks: false,
					},
					ticks: {
						...CHART_TICKS,
						color: COLORS.MUTED,
					},
				},
				y: {
					border: {
						display: false,
					},
					grid: {
						...CHART_GRID,
					},
					ticks: {
						...CHART_TICKS,
						padding: 15,
						color: COLORS.MUTED,
					},
				},
			},
		},
	};

	// Init chart
	if (WRAPPER) {
		new Chart(WRAPPER, CONFIG);
	}
};
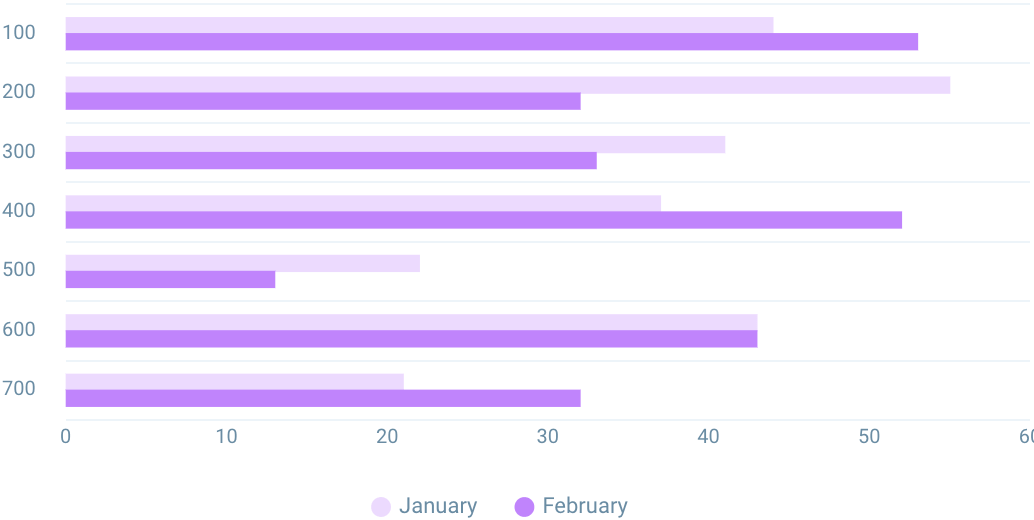
Horizontal Bar Chart
Bar chart with horizontal bars. This is a horizontal bar chart, where the bars are horizontal instead of vertical.
<div class="h-72">
    <canvas id="chart-horizontal-bar"></canvas>
</div>
import Chart from "chart.js/auto";
import { CHART_TICKS, chartTooltipStyle, CHART_LEGEND_LABEL, CHART_GRID } from "../../vendors/chart";
import { COLORS } from "../../constants";

export const horizontalBar = () => {
	const WRAPPER = document.getElementById("chart-horizontal-bar");

	// Chart data
	const DATA = {
		labels: ["100", "200", "300", "400", "500", "600", "700"],
		datasets: [
			{
				label: "January",
				data: [44, 55, 41, 37, 22, 43, 21],
				barThickness: 8,
				backgroundColor: "rgba(192, 132, 252, 0.3)",
				hoverBackgroundColor: "rgba(192, 132, 252, 0.3)",
			},
			{
				label: "February",
				data: [53, 32, 33, 52, 13, 43, 32],
				barThickness: 8,
				backgroundColor: "#c084fc",
				hoverBackgroundColor: "#c084fc",
			},
		],
	};

	// Chart config
	const CONFIG = {
		type: "bar",
		data: DATA,
		options: {
			maintainAspectRatio: false,
			indexAxis: "y",
			layout: {
				padding: {
					left: -8,
					right: 15,
				},
			},
			elements: {
				bar: {
					borderWidth: 0,
				},
			},
			responsive: true,
			plugins: {
				legend: {
					position: "bottom",
					labels: {
						color: COLORS.MUTED,
						...CHART_LEGEND_LABEL,
						usePointStyle: true,
					},
				},
				title: {
					display: false,
				},
				tooltip: {
					...chartTooltipStyle,
				},
			},
			scales: {
				x: {
					border: {
						display: false,
					},
					grid: {
						display: false,
						drawBorder: false,
						drawOnChartArea: false,
						drawTicks: false,
					},
					ticks: {
						...CHART_TICKS,
						color: COLORS.MUTED,
					},
				},
				y: {
					border: {
						display: false,
					},
					grid: {
						...CHART_GRID,
					},
					ticks: {
						...CHART_TICKS,
						padding: 15,
						color: COLORS.MUTED,
					},
				},
			},
		},
	};

	// Init chart
	if (WRAPPER) {
		new Chart(WRAPPER, CONFIG);
	}
};
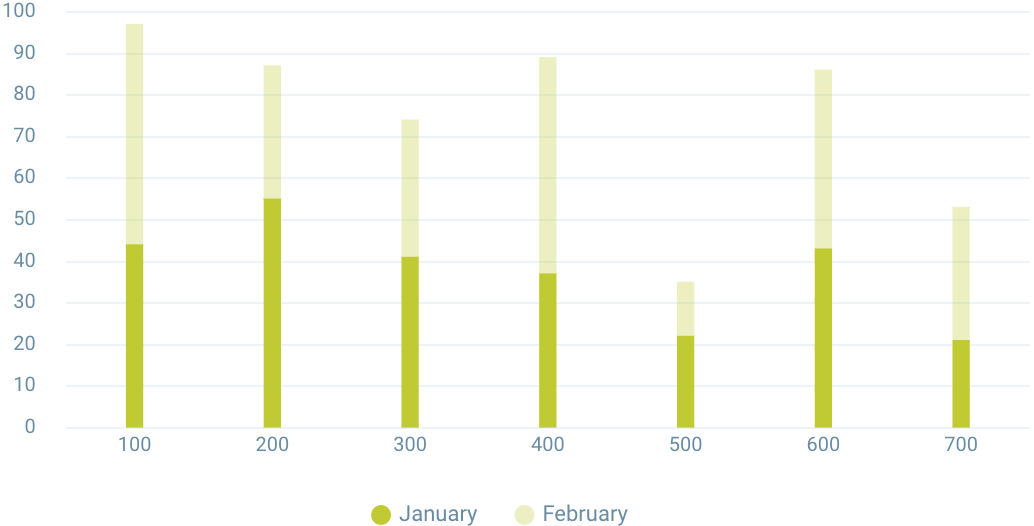
Stacked Bar Chart
Stacked bar charts are used to compare parts to a whole. They are useful for comparing the percentage of each category to the whole.
<div class="h-72">
    <canvas id="chart-stacked-bar"></canvas>
</div>
import Chart from "chart.js/auto";
import { CHART_TICKS, chartTooltipStyle, CHART_LEGEND_LABEL, reloadChart, CHART_GRID } from "../../vendors/chart";
import { COLORS } from "../../constants";

export const stackedBar = () => {
	const WRAPPER = document.getElementById("chart-stacked-bar");

	// Chart data
	const DATA = {
		labels: ["100", "200", "300", "400", "500", "600", "700"],
		datasets: [
			{
				label: "January",
				data: [44, 55, 41, 37, 22, 43, 21],
				barThickness: 8,
				backgroundColor: "#c0ca33",
				hoverBackgroundColor: "#c0ca33",
			},
			{
				label: "February",
				data: [53, 32, 33, 52, 13, 43, 32],
				barThickness: 8,
				backgroundColor: "rgba(192, 202, 51, 0.3)",
				hoverBackgroundColor: "rgba(192, 202, 51, 0.3)",
			},
		],
	};

	// Chart config
	const CONFIG = {
		type: "bar",
		data: DATA,
		options: {
			maintainAspectRatio: false,
			layout: {
				padding: {
					left: -8,
					right: 15,
				},
			},
			elements: {
				bar: {
					borderWidth: 0,
				},
			},
			responsive: true,
			plugins: {
				legend: {
					position: "bottom",
					labels: {
						usePointStyle: true,
						color: COLORS.MUTED,
						...CHART_LEGEND_LABEL,
					},
				},
				title: {
					display: false,
				},
				tooltip: {
					...chartTooltipStyle,
				},
			},
			scales: {
				x: {
					stacked: true,
					border: {
						display: false,
					},
					grid: {
						display: false,
						drawBorder: false,
						drawOnChartArea: false,
						drawTicks: false,
					},
					ticks: {
						...CHART_TICKS,
						color: COLORS.MUTED,
					},
				},
				y: {
					stacked: true,
					border: {
						display: false,
					},
					grid: {
						...CHART_GRID,
					},
					ticks: {
						...CHART_TICKS,
						padding: 15,
						color: COLORS.MUTED,
					},
				},
			},
		},
	};

	// Init chart
	if (WRAPPER) {
		new Chart(WRAPPER, CONFIG);
	}
};
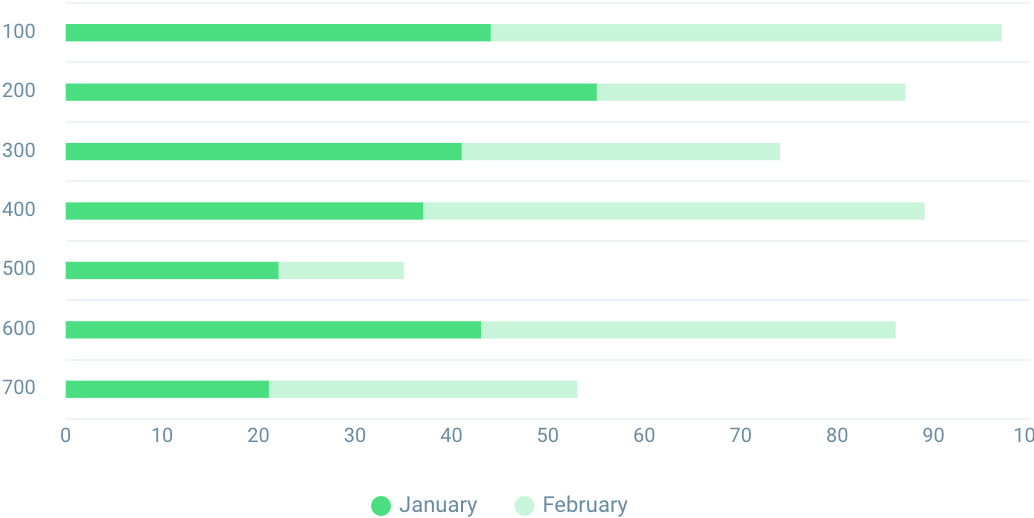
Stacked Horizontal Bar Chart
Stacked bar chart can also be positioned horizontly as well.
<div class="h-72">
    <canvas id="chart-stacked-horizontal-bar"></canvas>
</div>
import Chart from "chart.js/auto";
import { CHART_TICKS, chartTooltipStyle, CHART_LEGEND_LABEL, reloadChart, CHART_GRID } from "../../vendors/chart";
import { COLORS } from "../../constants";

export const stackedHorizontalBar = () => {
	const WRAPPER = document.getElementById("chart-stacked-horizontal-bar");

	// Chart data
	const DATA = {
		labels: ["100", "200", "300", "400", "500", "600", "700"],
		datasets: [
			{
				label: "January",
				data: [44, 55, 41, 37, 22, 43, 21],
				barThickness: 8,
				backgroundColor: "#4ade80",
				hoverBackgroundColor: "#4ade80",
			},
			{
				label: "February",
				data: [53, 32, 33, 52, 13, 43, 32],
				barThickness: 8,
				backgroundColor: "rgba(74, 222, 128, 0.3)",
				hoverBackgroundColor: "rgba(74, 222, 128, 0.3)",
			},
		],
	};

	// Chart config
	const CONFIG = {
		type: "bar",
		data: DATA,
		options: {
			maintainAspectRatio: false,
			indexAxis: "y",
			layout: {
				padding: {
					left: -8,
					right: 15,
				},
			},
			elements: {
				bar: {
					borderWidth: 0,
				},
			},
			responsive: true,
			plugins: {
				legend: {
					position: "bottom",
					labels: {
						usePointStyle: true,
						color: COLORS.MUTED,
						...CHART_LEGEND_LABEL,
					},
				},
				title: {
					display: false,
				},
				tooltip: {
					...chartTooltipStyle,
				},
			},
			scales: {
				x: {
					stacked: true,
					border: {
						display: false,
					},
					grid: {
						display: false,
						drawBorder: false,
						drawOnChartArea: false,
						drawTicks: false,
					},
					ticks: {
						...CHART_TICKS,
						color: COLORS.MUTED,
					},
				},
				y: {
					stacked: true,
					border: {
						display: false,
					},
					grid: {
						...CHART_GRID,
					},
					ticks: {
						...CHART_TICKS,
						padding: 15,
						color: COLORS.MUTED,
					},
				},
			},
		},
	};

	// Init chart
	if (WRAPPER) {
		new Chart(WRAPPER, CONFIG);
	}
};
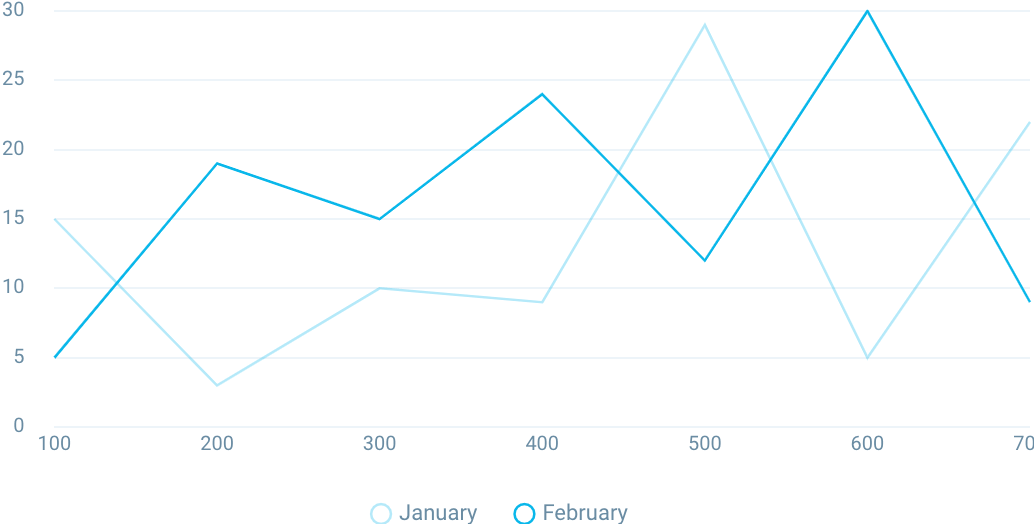
Line Chart
A line chart is a way of plotting data points on a line. Often, it is used to show trend data, or the comparison of two data sets.
<div class="h-72">
    <canvas id="chart-line"></canvas>
</div>
import Chart from "chart.js/auto";
import { CHART_TICKS, chartTooltipStyle, CHART_LEGEND_LABEL, CHART_GRID } from "../../vendors/chart";
import { COLORS } from "../../constants";

export const line = () => {
	const WRAPPER = document.getElementById("chart-line");

	// Chart data
	const DATA = {
		labels: ["100", "200", "300", "400", "500", "600", "700"],
		datasets: [
			{
				label: "January",
				data: [15, 3, 10, 9, 29, 5, 22],
				borderColor: "rgba(9, 182, 234, 0.30)",
				backgroundColor: "transparent",
				hoverBackgroundColor: "rgba(9, 182, 234, 0.30)",
				borderWidth: 1.25,
				pointRadius: 0,
				pointBackgroundColor: "transparent",
				pointBorderColor: "rgba(9, 182, 234, 0.30)",
				pointHoverBorderColor: "rgba(9, 182, 234, 0.30)",
				pointHoverBorderWidth: 1.75,
				pointHoverBackgroundColor: "rgba(9, 182, 234, 0.30)",
			},
			{
				label: "February",
				data: [5, 19, 15, 24, 12, 30, 9],
				borderColor: "#09b7ea",
				backgroundColor: "transparent",
				hoverBackgroundColor: "#09b7ea",
				borderWidth: 1.25,
				pointRadius: 0,
				pointBackgroundColor: "transparent",
				pointBorderColor: "#09b7ea",
				pointHoverBorderColor: "#09b7ea",
				pointHoverBorderWidth: 1.75,
				pointHoverBackgroundColor: "#09b7ea",
			},
		],
	};

	// Chart config
	const CONFIG = {
		type: "line",
		data: DATA,
		options: {
			maintainAspectRatio: false,
			interaction: {
				mode: "index",
				intersect: false,
			},
			layout: {
				padding: {
					left: -8,
					right: 15,
				},
			},
			responsive: true,
			plugins: {
				legend: {
					position: "bottom",
					labels: {
						color: COLORS.MUTED,
						usePointStyle: true,
						...CHART_LEGEND_LABEL,
					},
				},
				title: {
					display: false,
				},
				tooltip: {
					...chartTooltipStyle,
				},
			},
			scales: {
				x: {
					border: {
						display: false,
					},
					grid: {
						display: false,
						drawBorder: false,
						drawOnChartArea: false,
						drawTicks: false,
					},
					ticks: {
						...CHART_TICKS,
						color: COLORS.MUTED,
					},
				},
				y: {
					border: {
						display: false,
					},
					grid: {
						...CHART_GRID,
					},
					ticks: {
						...CHART_TICKS,
						padding: 15,
						color: COLORS.MUTED,
					},
				},
			},
		},
	};

	// Init chart
	if (WRAPPER) {
		new Chart(WRAPPER, CONFIG);
	}
};
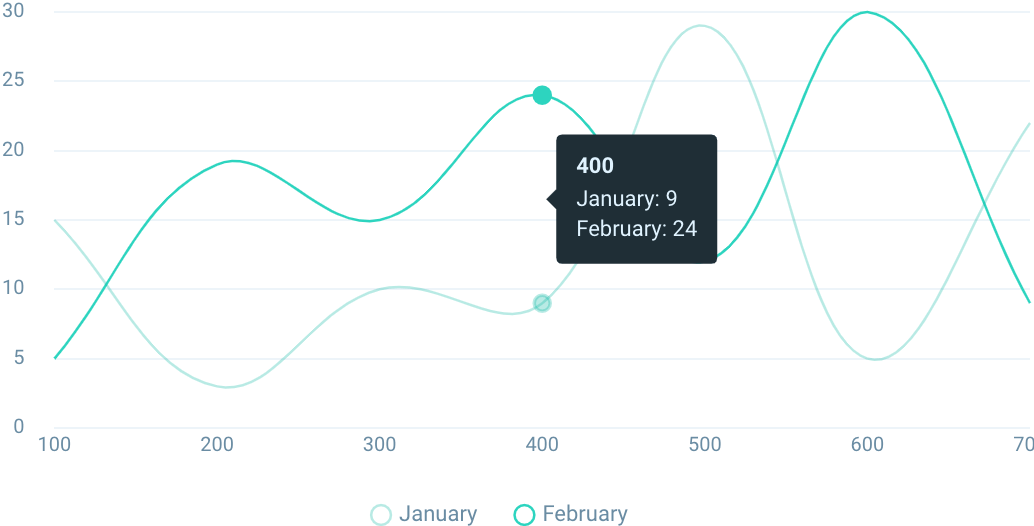
Curved Line Chart
Curved lines are possible using the tension property of the line chart.
<div class="h-72">
    <canvas id="chart-curved-line"></canvas>
</div>
import Chart from "chart.js/auto";
import { CHART_TICKS, chartTooltipStyle, CHART_LEGEND_LABEL, CHART_GRID } from "../../vendors/chart";
import { COLORS } from "../../constants";

export const curvedLine = () => {
	const WRAPPER = document.getElementById("chart-curved-line");

	// Chart data
	const DATA = {
		labels: ["100", "200", "300", "400", "500", "600", "700"],
		datasets: [
			{
				label: "January",
				data: [15, 3, 10, 9, 29, 5, 22],
				borderColor: "rgb(20, 184, 166, 0.3)",
				backgroundColor: "transparent",
				hoverBackgroundColor: "rgb(20, 184, 166, 0.3)",
				borderWidth: 1.25,
				pointRadius: 0,
				tension: 0.4,
				pointBackgroundColor: "transparent",
				pointBorderColor: "rgb(20, 184, 166, 0.3)",
				pointHoverBorderColor: "rgb(20, 184, 166, 0.3)",
				pointHoverBorderWidth: 1.75,
				pointHoverBackgroundColor: "rgb(20, 184, 166, 0.3)",
			},
			{
				label: "February",
				data: [5, 19, 15, 24, 12, 30, 9],
				borderColor: "#2dd4bf",
				backgroundColor: "transparent",
				hoverBackgroundColor: "#2dd4bf",
				borderWidth: 1.25,
				pointRadius: 0,
				tension: 0.4,
				pointBackgroundColor: "transparent",
				pointBorderColor: "#2dd4bf",
				pointHoverBorderColor: "#2dd4bf",
				pointHoverBorderWidth: 1.75,
				pointHoverBackgroundColor: "#2dd4bf",
			},
		],
	};

	// Chart config
	const CONFIG = {
		type: "line",
		data: DATA,
		options: {
			maintainAspectRatio: false,
			interaction: {
				mode: "index",
				intersect: false,
			},
			layout: {
				padding: {
					left: -8,
					right: 15,
				},
			},
			responsive: true,
			plugins: {
				legend: {
					position: "bottom",
					labels: {
						color: COLORS.MUTED,
						usePointStyle: true,
						...CHART_LEGEND_LABEL,
					},
				},
				title: {
					display: false,
				},
				tooltip: {
					...chartTooltipStyle,
				},
			},
			scales: {
				x: {
					border: {
						display: false,
					},
					grid: {
						display: false,
						drawBorder: false,
						drawOnChartArea: false,
						drawTicks: false,
					},
					ticks: {
						...CHART_TICKS,
						color: COLORS.MUTED,
					},
				},
				y: {
					border: {
						display: false,
					},
					grid: {
						...CHART_GRID,
					},
					ticks: {
						...CHART_TICKS,
						padding: 15,
						color: COLORS.MUTED,
					},
				},
			},
		},
	};

	// Init chart
	if (WRAPPER) {
		new Chart(WRAPPER, CONFIG);
	}
};
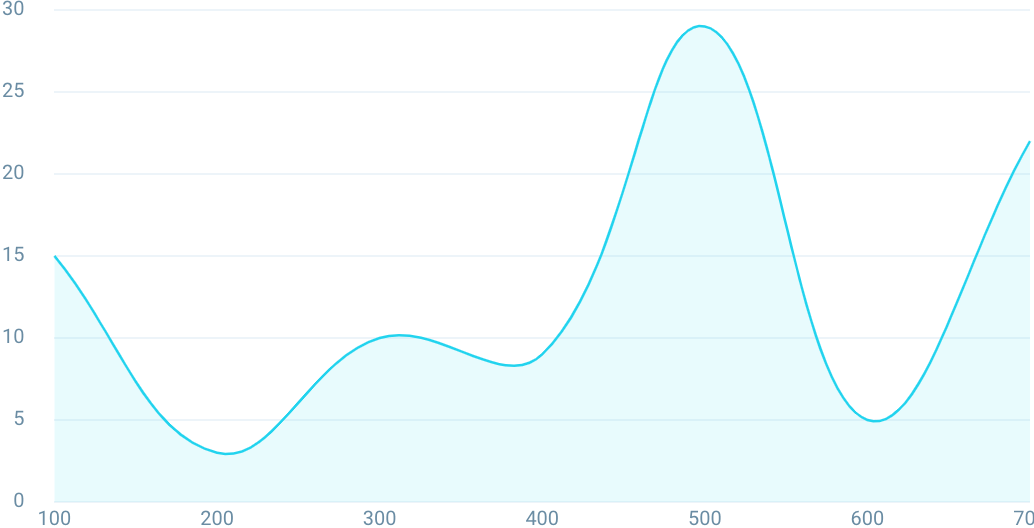
Area Chart
An area chart is a line chart where the area between the line and axes are filled with color or texture. Often, it is used to show trend data, and the comparison of two data sets.
<div class="h-72">
    <canvas id="chart-area"></canvas>
</div>
import Chart from "chart.js/auto";
import { CHART_TICKS, chartTooltipStyle, CHART_LEGEND_LABEL, CHART_GRID } from "../../vendors/chart";
import { COLORS } from "../../constants";

export const area = () => {
	const WRAPPER = document.getElementById("chart-area");

	// Chart data
	const DATA = {
		labels: ["100", "200", "300", "400", "500", "600", "700"],
		datasets: [
			{
				label: "January",
				data: [15, 3, 10, 9, 29, 5, 22],
				fill: true,
				borderColor: "#22d3ee",
				backgroundColor: "rgba(34, 211, 238, 0.1)",
				hoverBackgroundColor: "rgba(34, 211, 238, 0.1)",
				borderWidth: 1.25,
				pointRadius: 0,
				tension: 0.4,
				pointBackgroundColor: "#22d3ee",
				pointBorderColor: "#22d3ee",
				pointHoverBorderColor: "#22d3ee",
				pointHoverBorderWidth: 1.75,
				pointHoverBackgroundColor: "#22d3ee",
			},
		],
	};

	// Chart config
	const CONFIG = {
		type: "line",
		data: DATA,
		options: {
			maintainAspectRatio: false,
			interaction: {
				mode: "index",
				intersect: false,
			},
			layout: {
				padding: {
					left: -8,
					right: 15,
				},
			},
			responsive: true,
			plugins: {
				legend: {
					display: false,
				},
				title: {
					display: false,
				},
				tooltip: {
					...chartTooltipStyle,
				},
			},
			scales: {
				x: {
					border: {
						display: false,
					},
					grid: {
						display: false,
						drawBorder: false,
						drawOnChartArea: false,
						drawTicks: false,
					},
					ticks: {
						...CHART_TICKS,
						color: COLORS.MUTED,
					},
				},
				y: {
					border: {
						display: false,
					},
					grid: {
						...CHART_GRID,
					},
					ticks: {
						...CHART_TICKS,
						padding: 15,
						color: COLORS.MUTED,
					},
				},
			},
		},
	};

	// Init chart
	if (WRAPPER) {
		new Chart(WRAPPER, CONFIG);
	}
};
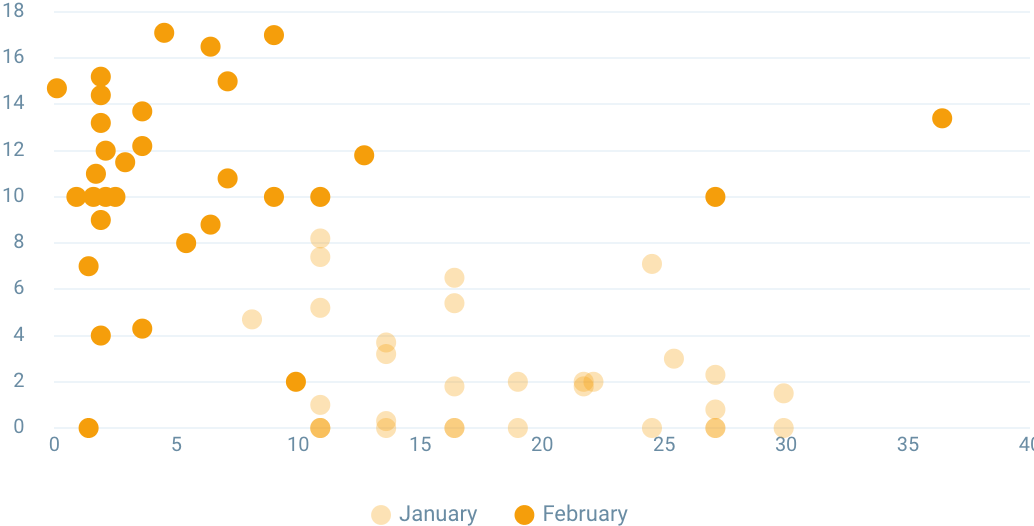
Scatter
Scatter charts are based on basic line charts with the x axis changed to a linear axis. To use a scatter chart, data must be passed as objects containing X and Y properties.
<div class="h-72">
    <canvas id="chart-scatter"></canvas>
</div>
import Chart from "chart.js/auto";
import { CHART_TICKS, chartTooltipStyle, CHART_LEGEND_LABEL, CHART_GRID } from "../../vendors/chart";
import { COLORS } from "../../constants";

export const scatter = () => {
	const WRAPPER = document.getElementById("chart-scatter");

	// Chart data
	const SCATTER_DATA_1 = [
		{
			x: 16.4,
			y: 5.4,
		},
		{
			x: 21.7,
			y: 2,
		},
		{
			x: 25.4,
			y: 3,
		},
		{
			x: 19,
			y: 2,
		},
		{
			x: 10.9,
			y: 1,
		},
		{
			x: 13.6,
			y: 3.2,
		},
		{
			x: 10.9,
			y: 7.4,
		},
		{
			x: 10.9,
			y: 0,
		},
		{
			x: 10.9,
			y: 8.2,
		},
		{
			x: 16.4,
			y: 0,
		},
		{
			x: 16.4,
			y: 1.8,
		},
		{
			x: 13.6,
			y: 0.3,
		},
		{
			x: 13.6,
			y: 0,
		},
		{
			x: 29.9,
			y: 0,
		},
		{
			x: 27.1,
			y: 2.3,
		},
		{
			x: 16.4,
			y: 0,
		},
		{
			x: 13.6,
			y: 3.7,
		},
		{
			x: 10.9,
			y: 5.2,
		},
		{
			x: 16.4,
			y: 6.5,
		},
		{
			x: 10.9,
			y: 0,
		},
		{
			x: 24.5,
			y: 7.1,
		},
		{
			x: 10.9,
			y: 0,
		},
		{
			x: 8.1,
			y: 4.7,
		},
		{
			x: 19,
			y: 0,
		},
		{
			x: 21.7,
			y: 1.8,
		},
		{
			x: 27.1,
			y: 0,
		},
		{
			x: 24.5,
			y: 0,
		},
		{
			x: 27.1,
			y: 0,
		},
		{
			x: 29.9,
			y: 1.5,
		},
		{
			x: 27.1,
			y: 0.8,
		},
		{
			x: 22.1,
			y: 2,
		},
	];

	const SCATTER_DATA_2 = [
		{
			x: 36.4,
			y: 13.4,
		},
		{
			x: 1.7,
			y: 11,
		},
		{
			x: 5.4,
			y: 8,
		},
		{
			x: 9,
			y: 17,
		},
		{
			x: 1.9,
			y: 4,
		},
		{
			x: 3.6,
			y: 12.2,
		},
		{
			x: 1.9,
			y: 14.4,
		},
		{
			x: 1.9,
			y: 9,
		},
		{
			x: 1.9,
			y: 13.2,
		},
		{
			x: 1.4,
			y: 7,
		},
		{
			x: 6.4,
			y: 8.8,
		},
		{
			x: 3.6,
			y: 4.3,
		},
		{
			x: 1.6,
			y: 10,
		},
		{
			x: 9.9,
			y: 2,
		},
		{
			x: 7.1,
			y: 15,
		},
		{
			x: 1.4,
			y: 0,
		},
		{
			x: 3.6,
			y: 13.7,
		},
		{
			x: 1.9,
			y: 15.2,
		},
		{
			x: 6.4,
			y: 16.5,
		},
		{
			x: 0.9,
			y: 10,
		},
		{
			x: 4.5,
			y: 17.1,
		},
		{
			x: 10.9,
			y: 10,
		},
		{
			x: 0.1,
			y: 14.7,
		},
		{
			x: 9,
			y: 10,
		},
		{
			x: 12.7,
			y: 11.8,
		},
		{
			x: 2.1,
			y: 10,
		},
		{
			x: 2.5,
			y: 10,
		},
		{
			x: 27.1,
			y: 10,
		},
		{
			x: 2.9,
			y: 11.5,
		},
		{
			x: 7.1,
			y: 10.8,
		},
		{
			x: 2.1,
			y: 12,
		},
	];

	const DATA = {
		labels: ["100", "200", "300", "400", "500", "600", "700"],
		datasets: [
			{
				label: "January",
				data: SCATTER_DATA_1,
				pointRadius: 5,
				pointHoverRadius: 6,
				pointBorderColor: "transparent",
				pointHoverBorderColor: "transparent",
				pointBackgroundColor: "rgba(245, 158, 11, 0.3)",
				pointHoverBackgroundColor: "rgba(245, 158, 11, 0.3)",
			},
			{
				label: "February",
				data: SCATTER_DATA_2,
				pointRadius: 5,
				pointHoverRadius: 6,
				pointBorderColor: "transparent",
				pointHoverBorderColor: "transparent",
				pointBackgroundColor: "#f59e0b",
				pointHoverBackgroundColor: "#f59e0b",
			},
		],
	};

	// Chart config
	const CONFIG = {
		type: "scatter",
		data: DATA,
		options: {
			maintainAspectRatio: false,
			interaction: {
				mode: "index",
				intersect: false,
			},
			layout: {
				padding: {
					left: -8,
					right: 15,
				},
			},
			responsive: true,
			plugins: {
				legend: {
					position: "bottom",
					labels: {
						color: COLORS.MUTED,
						usePointStyle: true,
						...CHART_LEGEND_LABEL,
					},
				},
				title: {
					display: false,
				},
				tooltip: {
					...chartTooltipStyle,
				},
			},
			scales: {
				x: {
					border: {
						display: false,
					},
					grid: {
						display: false,
						drawBorder: false,
						drawOnChartArea: false,
						drawTicks: false,
					},
					ticks: {
						...CHART_TICKS,
						color: COLORS.MUTED,
					},
				},
				y: {
					border: {
						display: false,
					},
					grid: {
						...CHART_GRID,
					},
					ticks: {
						...CHART_TICKS,
						padding: 15,
						color: COLORS.MUTED,
					},
				},
			},
		},
	};

	// Init chart
	if (WRAPPER) {
		new Chart(WRAPPER, CONFIG);
	}
};
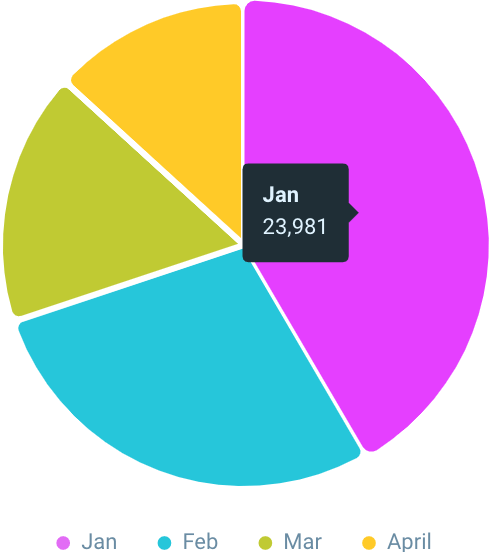
Pie Chart
pie charts are divided into segments, the arc of each segment shows the proportional value of each piece of data.
<div class="h-72">
    <canvas id="chart-pie"></canvas>
</div>
import Chart from "chart.js/auto";
import { chartTooltipStyle, CHART_LEGEND_LABEL, reloadChart } from "../../vendors/chart";
import { cssVar } from "../../utils";
import { COLORS } from "../../constants";

const WRAPPER = document.getElementById("chart-pie");
let chart;

export const pie = () => {
	const DATA = {
		labels: ["Jan", "Feb", "Mar", "April"],
		datasets: [
			{
				data: [23981, 16342, 9736, 7632],
				backgroundColor: [COLORS.PURPLE, COLORS.CYAN, COLORS.LIME, COLORS.AMBER],
				borderWidth: 3,
				borderColor: cssVar("--chart-pie-border"),
				hoverOffset: 1,
				hoverBorderWidth: 0,
				borderRadius: 5,
			},
		],
	};

	// Chart config
	const CONFIG = {
		type: "pie",
		data: DATA,
		options: {
			maintainAspectRatio: false,
			interaction: {
				mode: "index",
				intersect: false,
			},
			responsive: true,
			plugins: {
				legend: {
					position: "bottom",
					labels: {
						color: COLORS.MUTED,
						usePointStyle: true,
						...CHART_LEGEND_LABEL,
					},
				},
				title: {
					display: false,
				},
				tooltip: {
					...chartTooltipStyle,
				},
			},
		},
	};

	// Init chart
	if (WRAPPER) {
		chart = new Chart(WRAPPER, CONFIG);
	}
};
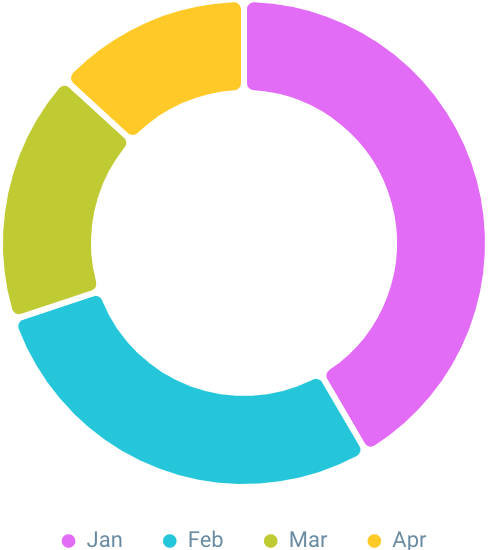
Daughnut Chart
Doughnut charts are similar to pie charts, but have a cutout which looks like a doughnut. This can be used to show the relationship of a part to a whole.
<div class="h-72">
    <canvas id="chart-doughnut"></canvas>
</div>
import Chart from "chart.js/auto";
import { chartTooltipStyle, CHART_LEGEND_LABEL, reloadChart } from "../../vendors/chart";
import { cssVar } from "../../utils";
import { COLORS } from "../../constants";

const WRAPPER = document.getElementById("chart-doughnut");
let chart;

export const doughnut = () => {
	const DATA = {
		labels: ["Jan", "Feb", "Mar", "Apr"],
		datasets: [
			{
				data: [23981, 16342, 9736, 7632],
				backgroundColor: [COLORS.PURPLE, COLORS.CYAN, COLORS.LIME, COLORS.AMBER],
				borderWidth: 3,
				borderColor: cssVar("--chart-pie-border"),
				hoverOffset: 1,
				hoverBorderWidth: 0,
				borderRadius: 5,
			},
		],
	};

	// Chart config
	const CONFIG = {
		type: "pie",
		data: DATA,
		options: {
			maintainAspectRatio: false,
			cutout: 75,
			interaction: {
				mode: "index",
				intersect: false,
			},
			responsive: true,
			plugins: {
				legend: {
					position: "bottom",
					labels: {
						color: COLORS.MUTED,
						usePointStyle: true,
						...CHART_LEGEND_LABEL,
					},
				},
				title: {
					display: false,
				},
				tooltip: {
					...chartTooltipStyle,
				},
			},
		},
	};

	// Init chart
	if (WRAPPER) {
		chart = new Chart(WRAPPER, CONFIG);
	}
};